Analytics / Live conversation / Working concept
What if your analyst
could join the call?
Ask the question when it comes up. Let the evidence arrive in the conversation.
01 / The familiar pause
“Do we know why sales moved?”
You’re in a weekly business review. Someone is sharing a dashboard. Sales are up. Great. Then someone asks whether traffic went up too, or whether the same people are buying more.
Now the conversation pauses. Someone finds another report, changes a filter, or says they’ll come back with the number after the call.
The question was useful at that moment. The answer often arrives after everybody has moved on.
That’s the opportunity I wanted to explore. What if an analyst could be part of the conversation, listen for the question, and bring up the relevant information while people are still discussing it?
02 / Start with the question
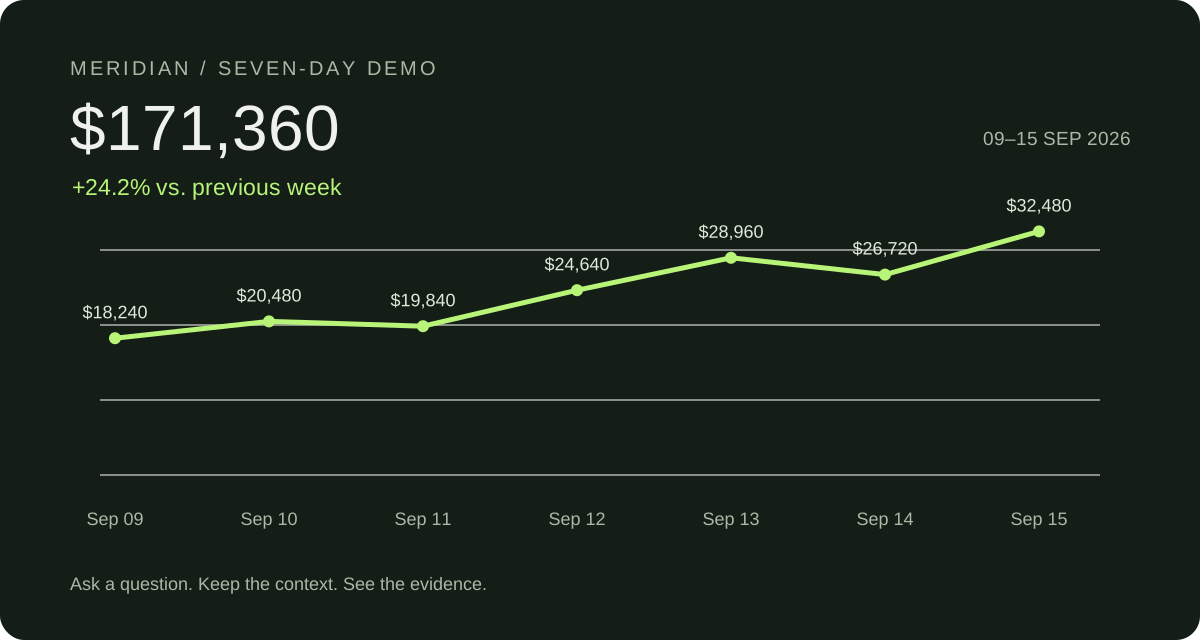
“Show me sales for the last seven days.”
Meridian is a small e-commerce analytics demo. You can ask for daily sales growth, traffic, or the top customers. The relevant chart or list becomes the main thing on the screen.
There’s a live voice orb, a text box, and sample questions if you need a starting point. The data is illustrative. The point is to explore how the conversation and the screen can work together.
03 / The screen is the answer
Ask a question. See the answer.
Ask for total sales and one large number fills the primary widget. Ask for a trend and a graph takes its place. Ask for daily detail and the same space becomes a table.
There are no dashboard tabs to navigate and no stack of old answers to sort through. Follow-ups can reuse the current metric and dates, but every data request replaces the main visual with the requested answer.
Voice and text provide context. The primary widget does the answering.
04 / Bring it into the room
The more interesting use case is the call itself.
Now take that a little further. Imagine inviting the analyst into a trading review, a marketing discussion, or a customer account call.
“Traffic looks healthy. Are we actually converting it?”
“Keep that up. Show me the day-by-day numbers.”
“Okay, who were our biggest customers this week?”
People shouldn’t have to turn every follow-up into a separate task for somebody else. The analyst could answer when addressed, put the supporting evidence on a shared screen, and stay with the discussion as the question changes.
In a trading review, that might mean comparing sales and sessions. In a marketing review, it could mean checking whether a campaign brought useful traffic. In an account discussion, it could mean answering a question about a customer’s purchasing history. The latter two would need connected campaign and account data; they aren’t in this demo.
This is the direction for the product. The current prototype runs in a browser. It does not yet join Zoom, Teams, or Google Meet, listen to meeting audio, or manage multiple speakers.
05 / Conversation needs evidence
Show the answer. Be clear about what you don’t know.
A confident voice isn’t enough. If the analyst says sales fell, people need to see the dates, the measure, and the comparison behind that statement.
In the demo, traffic means sessions. Conversion is orders divided by sessions. Top customers means spend during the selected demo week. Those definitions need to stay clear as the conversation moves.
And if someone asks why sales dipped, a sales chart alone doesn’t establish the cause. The useful response is to show what changed and say what additional evidence would be needed.
For a meeting version, I’d also want explicit permission to join, clear access to the data each audience can see, an obvious way to pause or remove the analyst, and control over which questions it answers aloud. Those are part of designing a useful participant.
06 / How the prototype works
The conversation and the screen share the same actions.
The voice integration uses Gemini 3.8 Live. The page exposes a WebMCP tool in supporting browsers, so an agent can replace the primary widget with a number, chart, or table. Voice tool calls and the page controls use the same underlying screen actions.
That gives the experience a clear rule: every data question updates the primary widget. The model gets the dataset and the resulting screen state back, so the interpretation can stay grounded in what is being shown.
The browser demo demonstrates that interaction with a one-year, ten-million-row DuckDB e-commerce database and CSV/Excel uploads. Meeting participation, live business integrations, and evidence of business impact are future work.
07 / What I’d want to learn
Does the answer arrive while it still matters?
I’d start with a small study: give teams the same set of business questions, first with a conventional dashboard and then with this conversational experience.
Look at how long it takes to get a verified answer, how often people lose the context of a follow-up, and whether they can explain the numbers they’ve just seen. For a meeting version, also watch how often the analyst interrupts unnecessarily or answers the wrong person’s question.
Those are questions to test, not results I’m claiming. A quicker answer only helps if people can understand it and trust the evidence behind it.
08 / Try the sequence
Start simply. Then keep asking.
Ask for sales. Ask for more detail. Compare the previous week. Then switch to traffic or top customers and watch how the screen follows the conversation.
Working browser concept · synthetic 2025 data · 10 million rows · no meeting-call integration yet. Text exploration is available without microphone access; live voice requires a configured Gemini session.